GTM Preview and Submit Guide
This guide explains how to use Preview in Google Tag Manager (GTM) to verify your configuration, then Submit the correct Workspace so it goes live, and how to check the result in JTracking’s Dashboard. It is for users who have already completed setup in JTracking and need to do final validation and publishing in GTM.
Overview
- Preview: Clicking Preview in GTM opens Tag Assistant (tagassistant.google.com) and puts the current GTM container in debug mode. You can see which tags fire, when, and with what parameters, without publishing.
- Submit: After confirming preview looks correct, click Submit in GTM to publish the current Workspace as a live version. Only then do JTracking-generated tags, triggers, and variables send real data to GA4, Meta, Google Ads, and other destinations.
- JTracking Dashboard: After Submit, use JTracking’s Dashboard to confirm data is flowing and to debug or monitor traffic (exact features depend on the current product).
Prerequisites
- You have completed GTM Connector, Server-side Setup, Platform Integration, and other config in JTracking, and have run Deploy (so JTracking has written config into your GTM container).
- You have edit/publish access to the target GTM container (at least able to open the Workspace and use Preview and Submit).
- The site you will preview has the same GTM container installed and loading (e.g. same domain as the one tied to that container).
1. How to Preview
1.1 Enter Preview mode
Step 1. Open Google Tag Manager, select your Account and the Container you use with JTracking.
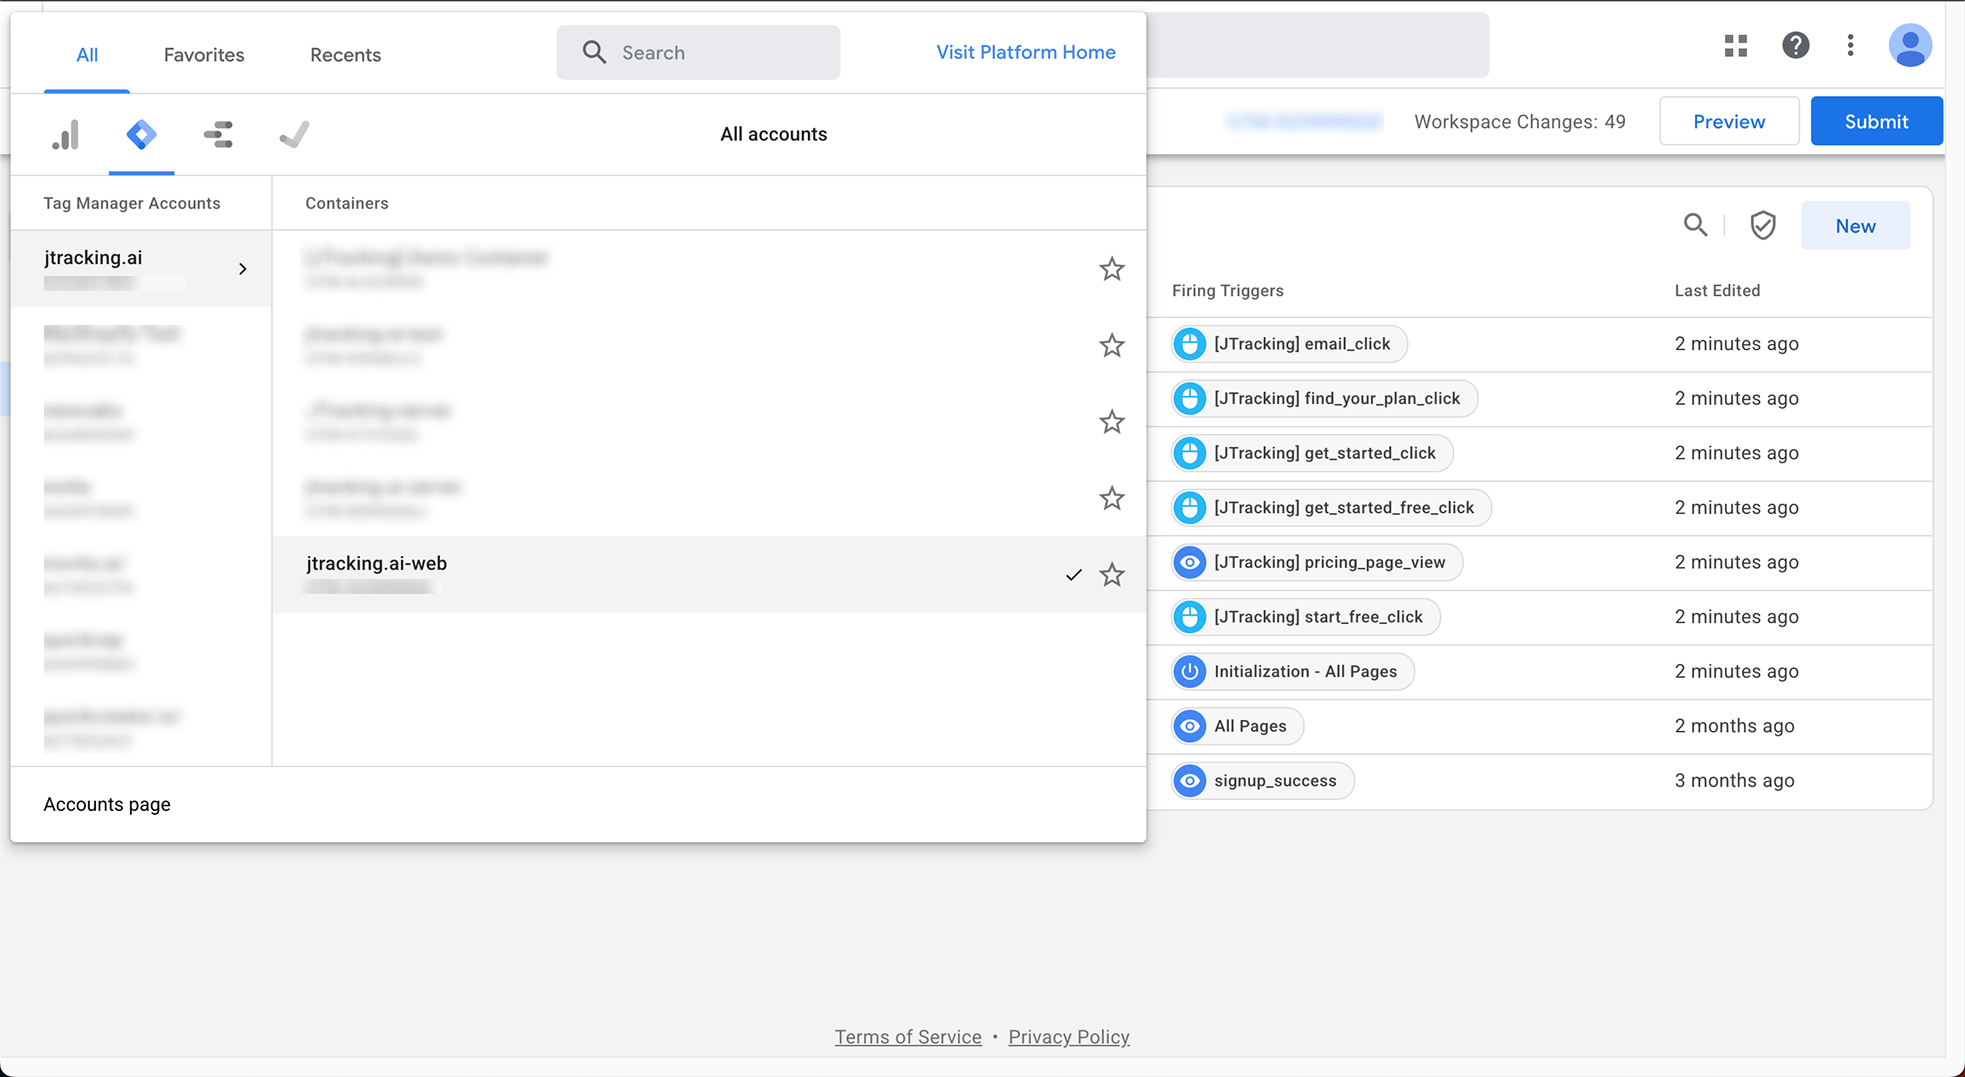
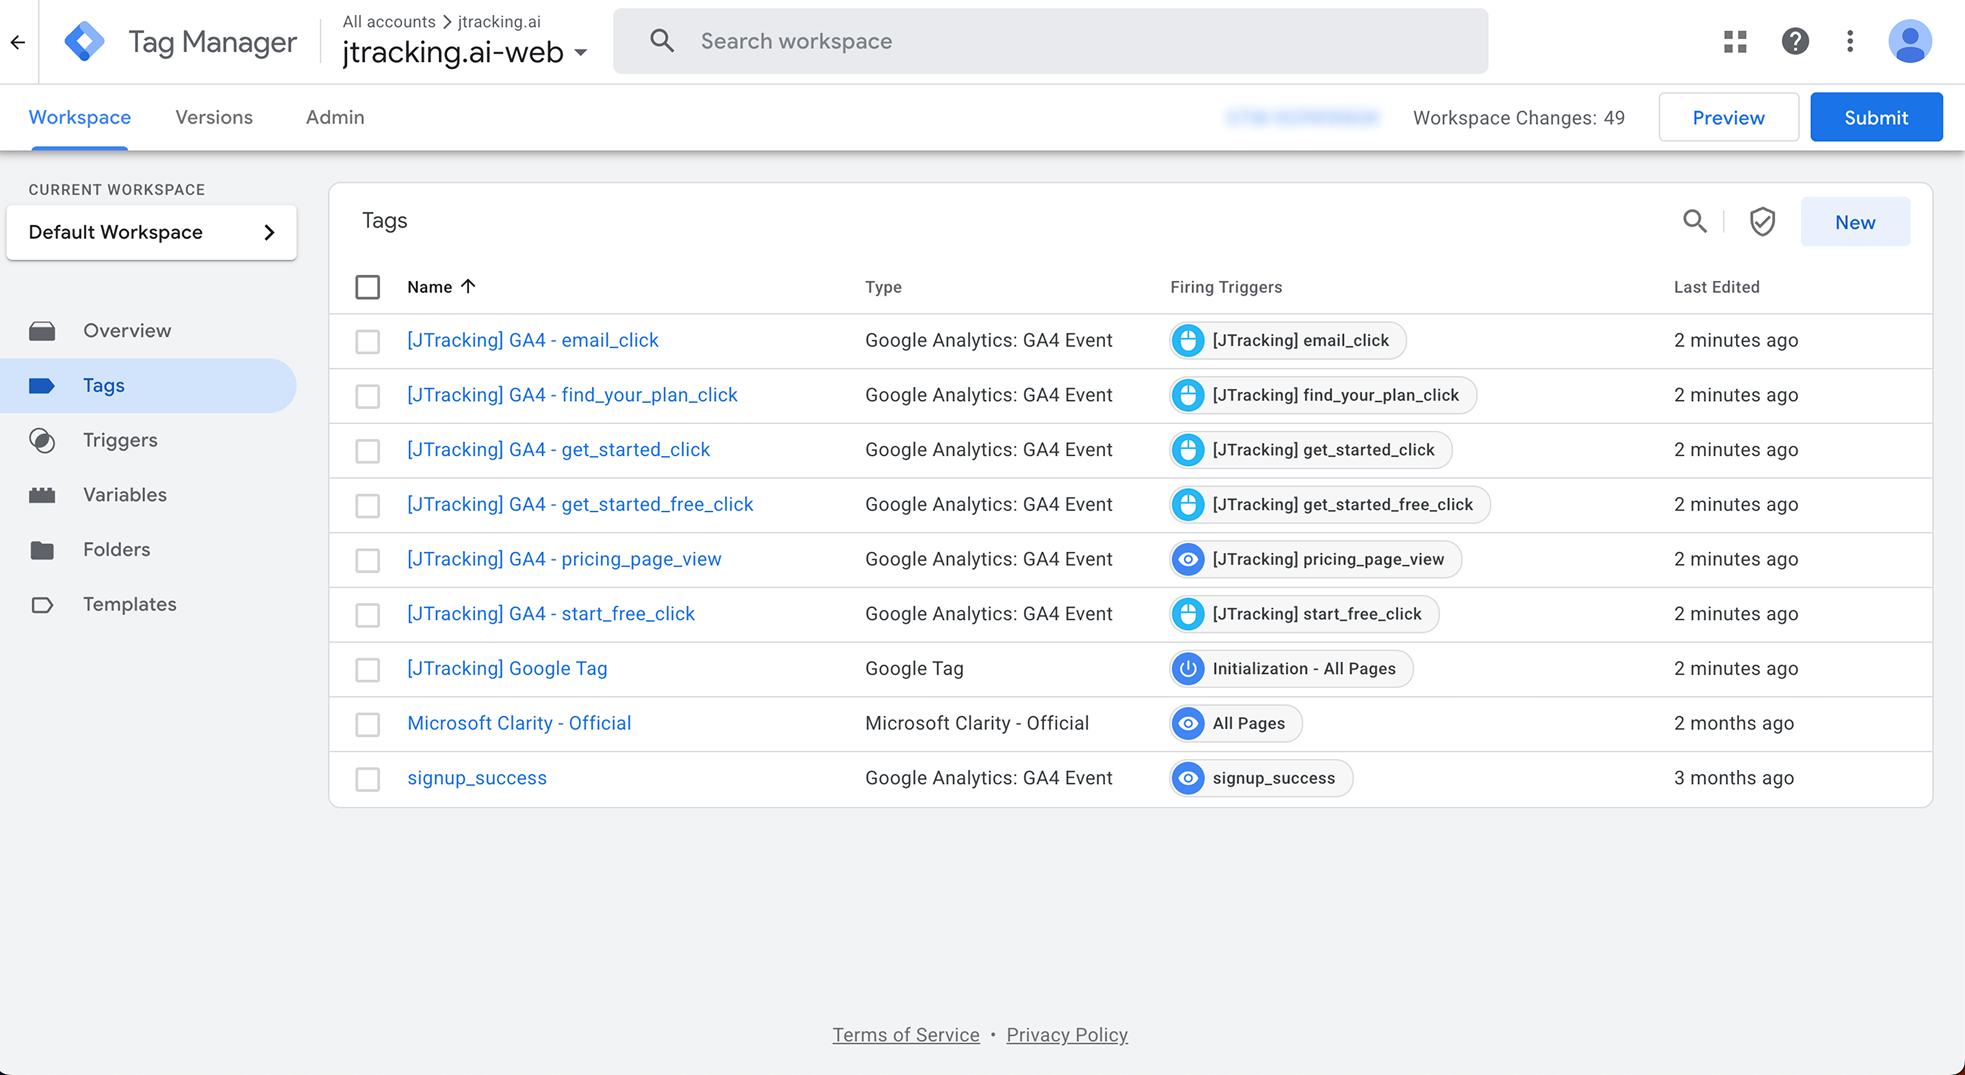
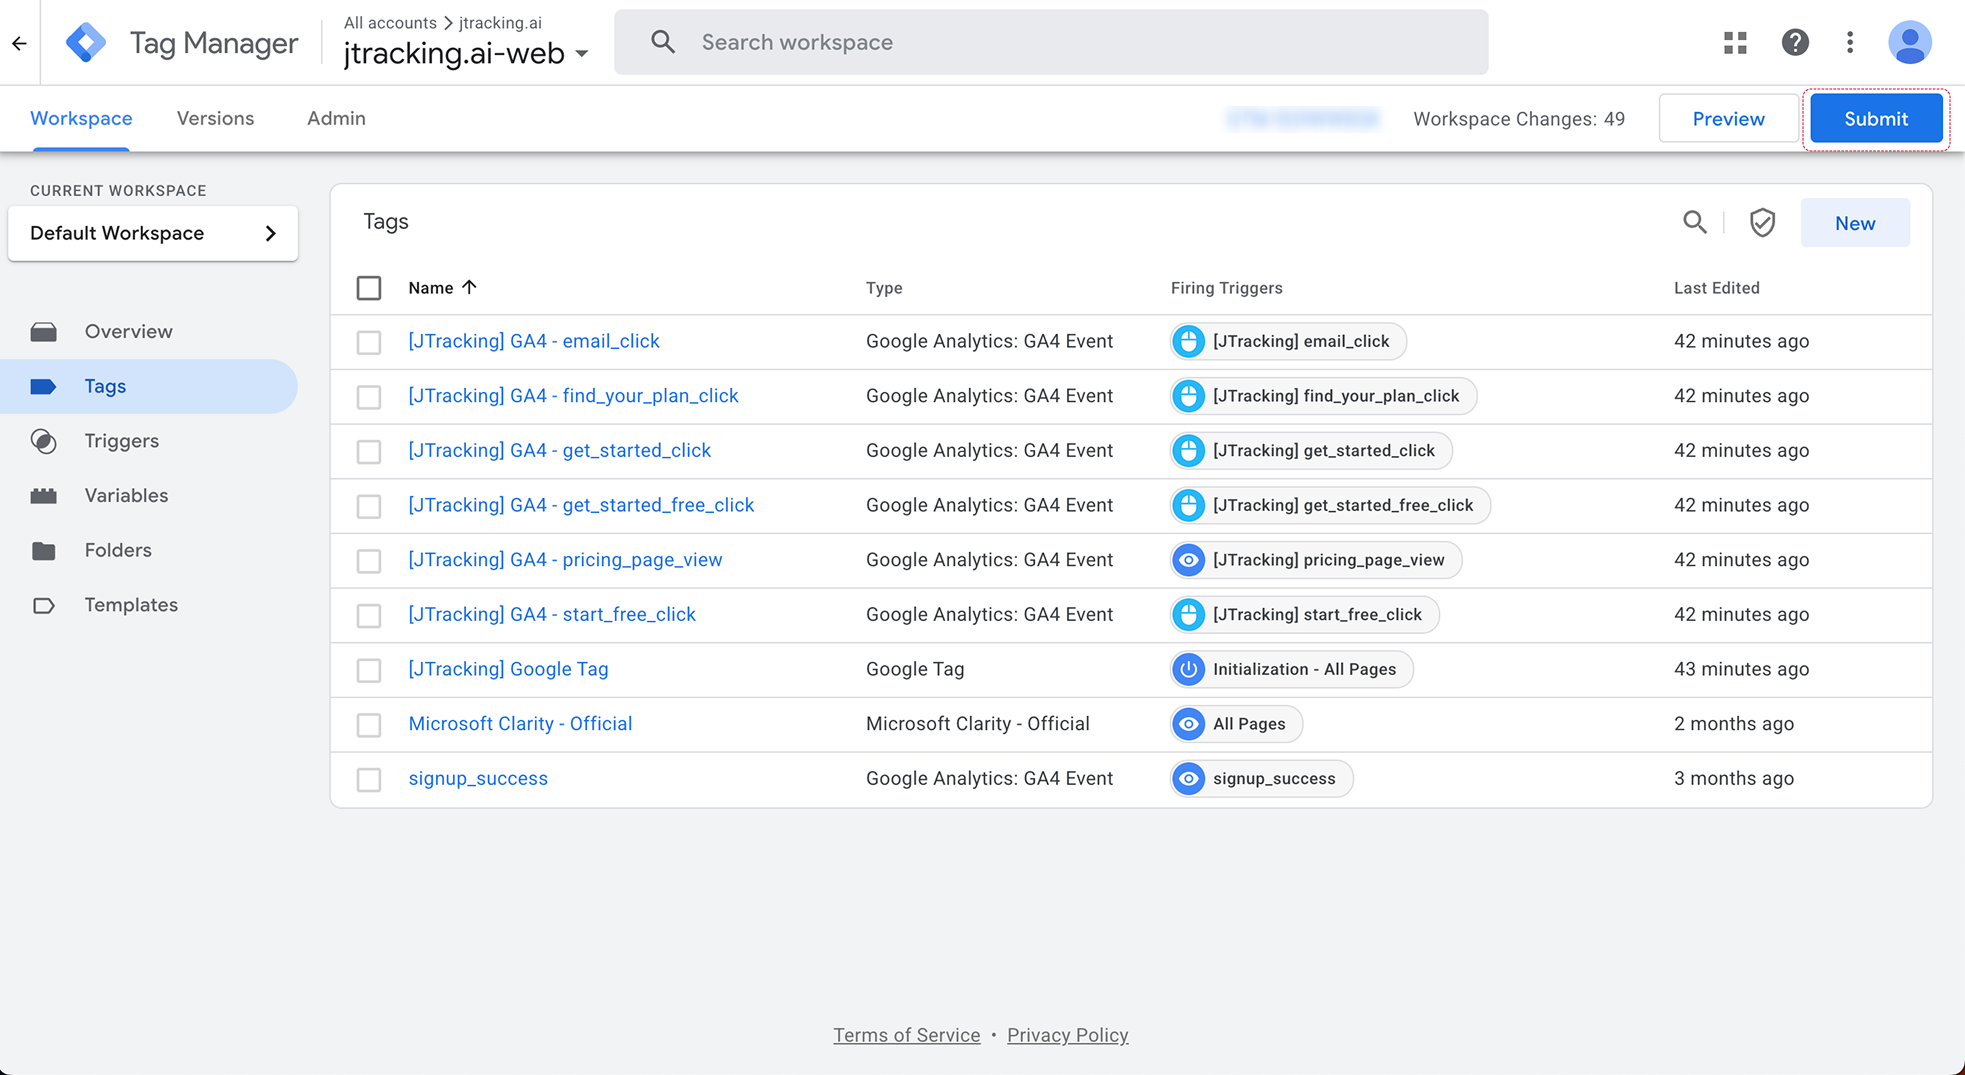
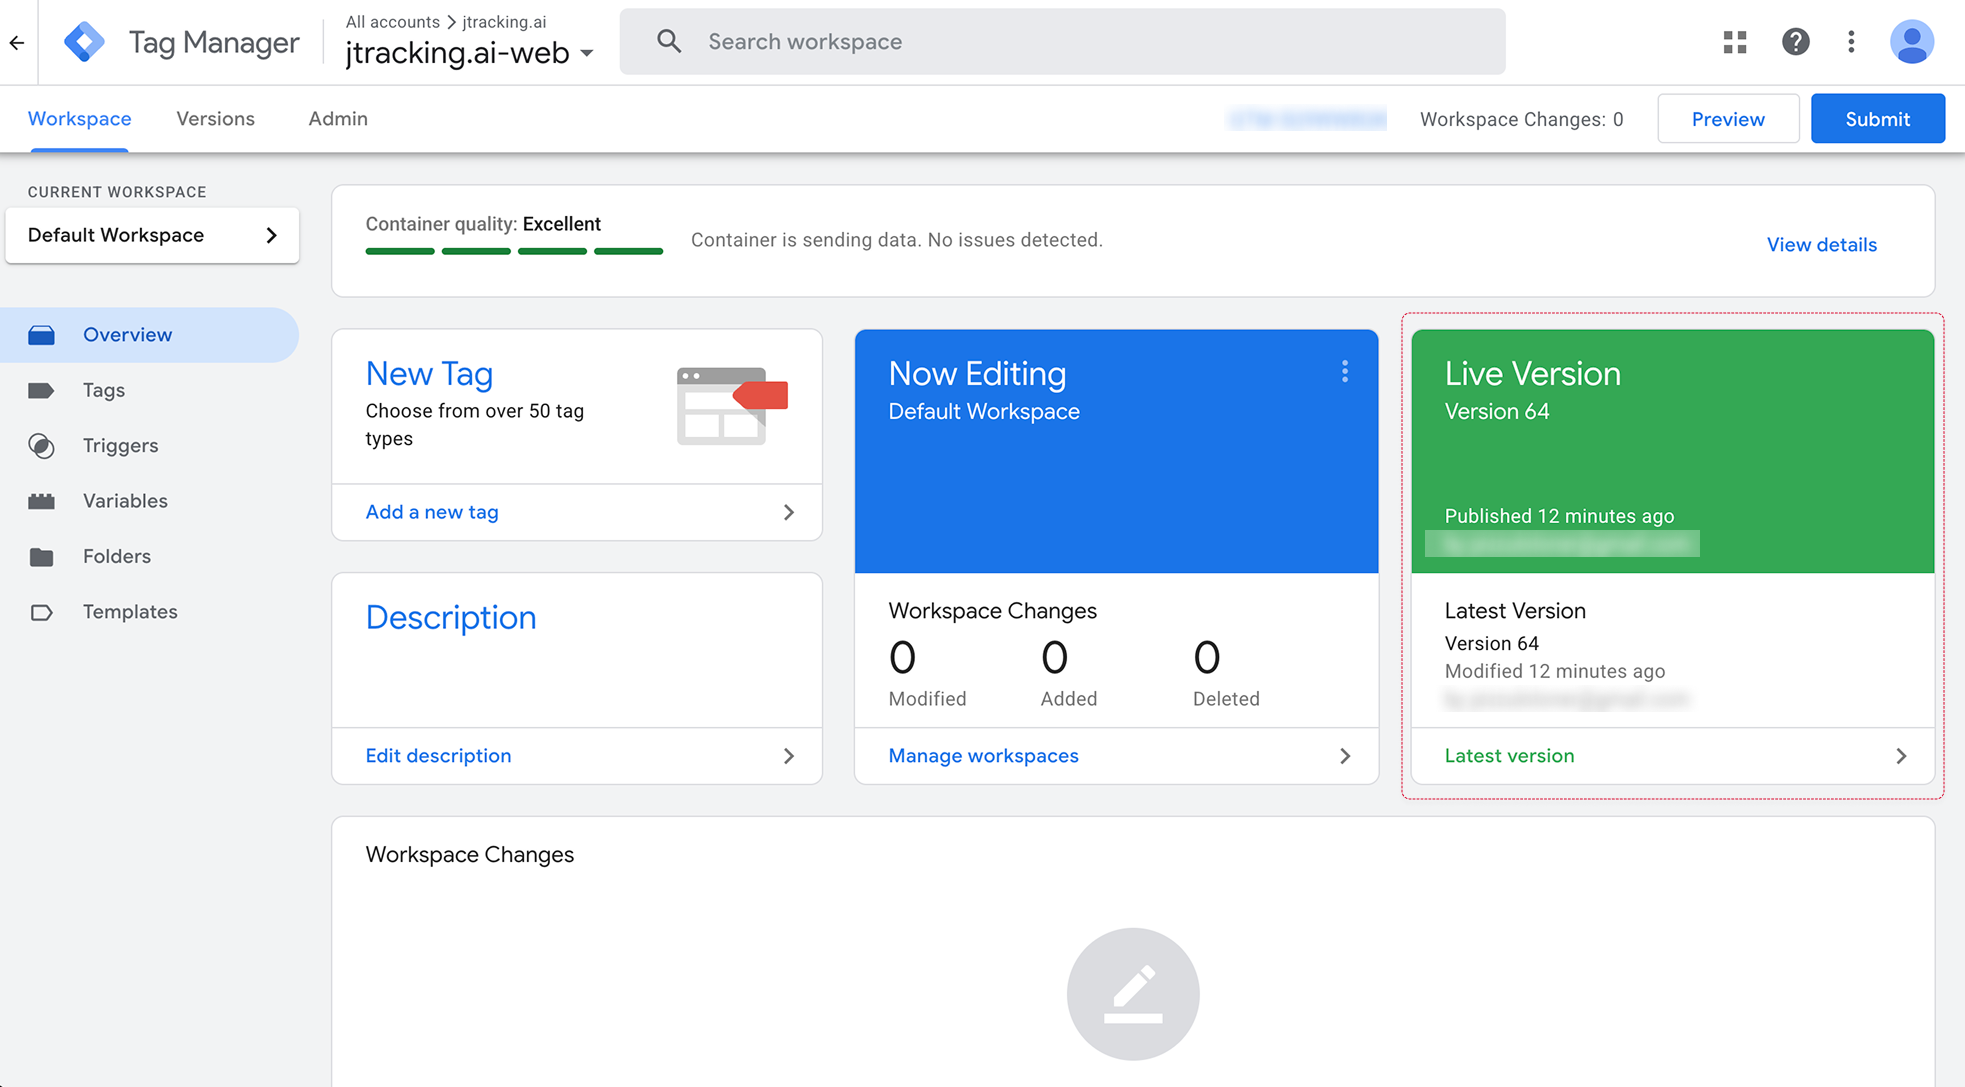
Step 2. In the left sidebar under CURRENT WORKSPACE, confirm the active workspace is the one you want to test (e.g. Default Workspace). You can confirm by opening Tags, Triggers, or Variables and checking that you see configurations whose names start with [JTracking] (e.g. [JTracking] Google Tag). If you see those, you are in the correct workspace.
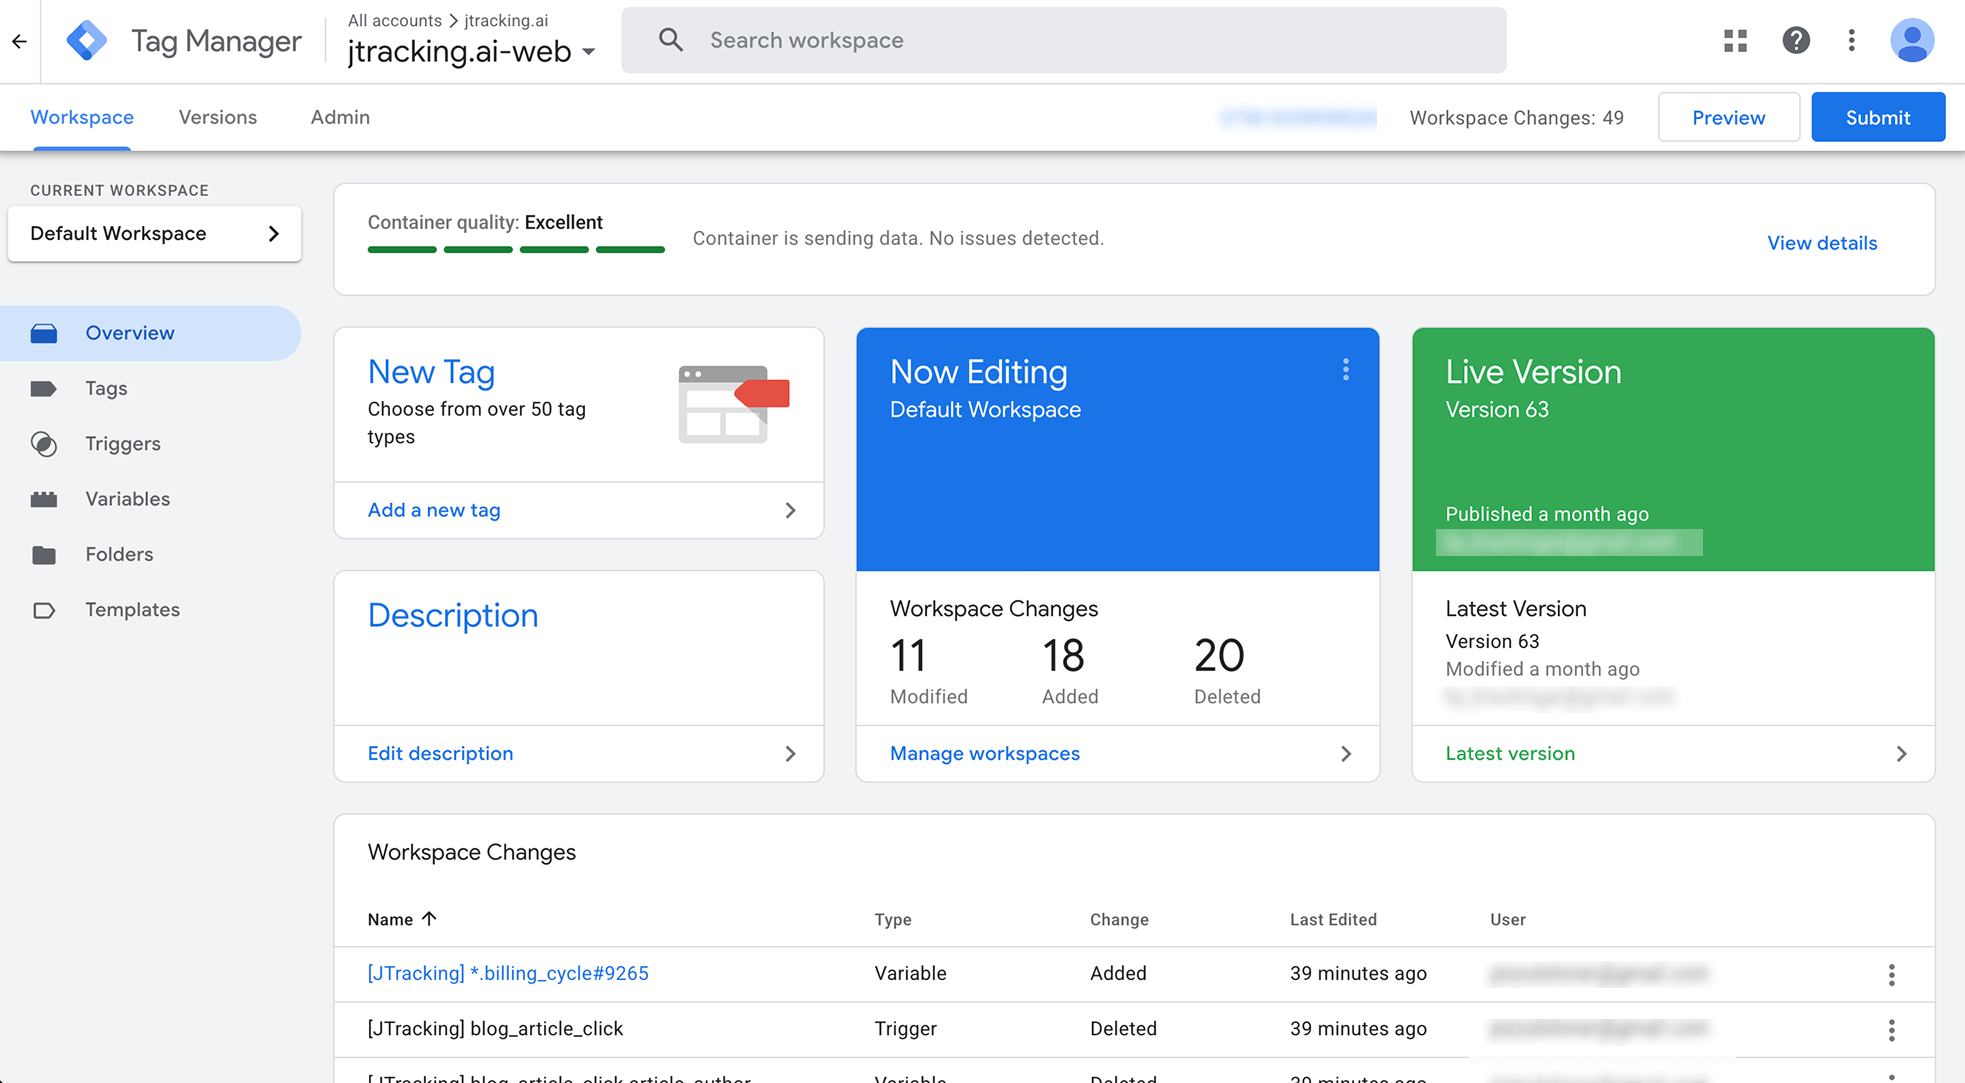
Step 3. In the top-right of the GTM page, click the Preview button. A new tab or window opens and loads Tag Assistant (tagassistant.google.com).

Note: The GTM UI shows Workspace Changes (e.g. Modified / Added / Deleted). What you preview is exactly the unpublished changes in this workspace; the same content will go live when you Submit.
1.2 Enter your test URL and connect
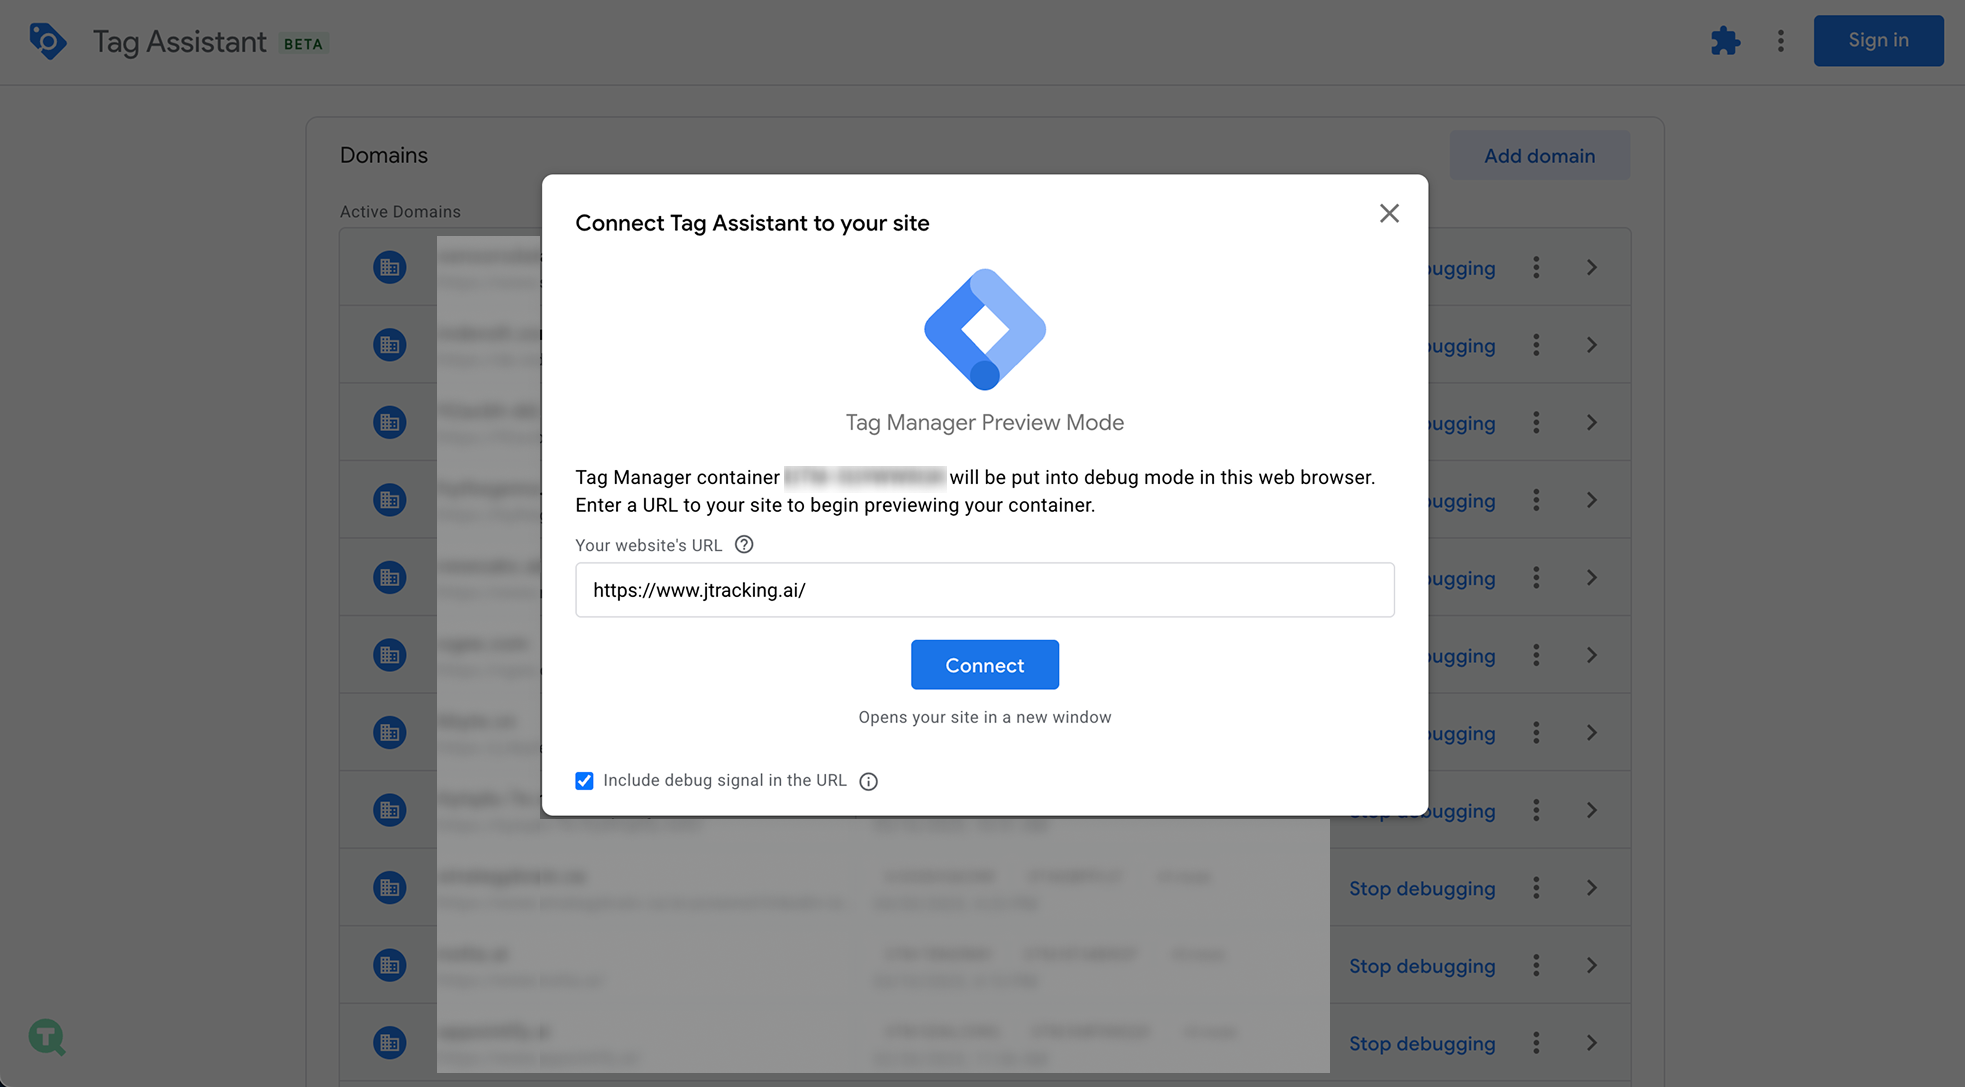
In the Tag Assistant window, in the “Connect Tag Assistant to your site” dialog:
Step 1. In the Your website's URL field, enter the full URL of the site you want to debug (e.g. https://www.jtracking.ai). Optionally leave Include debug signal in the URL checked so requests are clearly marked as debug. Click the Connect button.
1.3 View data status and fields
Step 1. In the preview site window, trigger the tracking by performing the actions you want to verify. For example, click Get Started Free, add to cart, or go through checkout—depending on which events you have configured in JTracking.
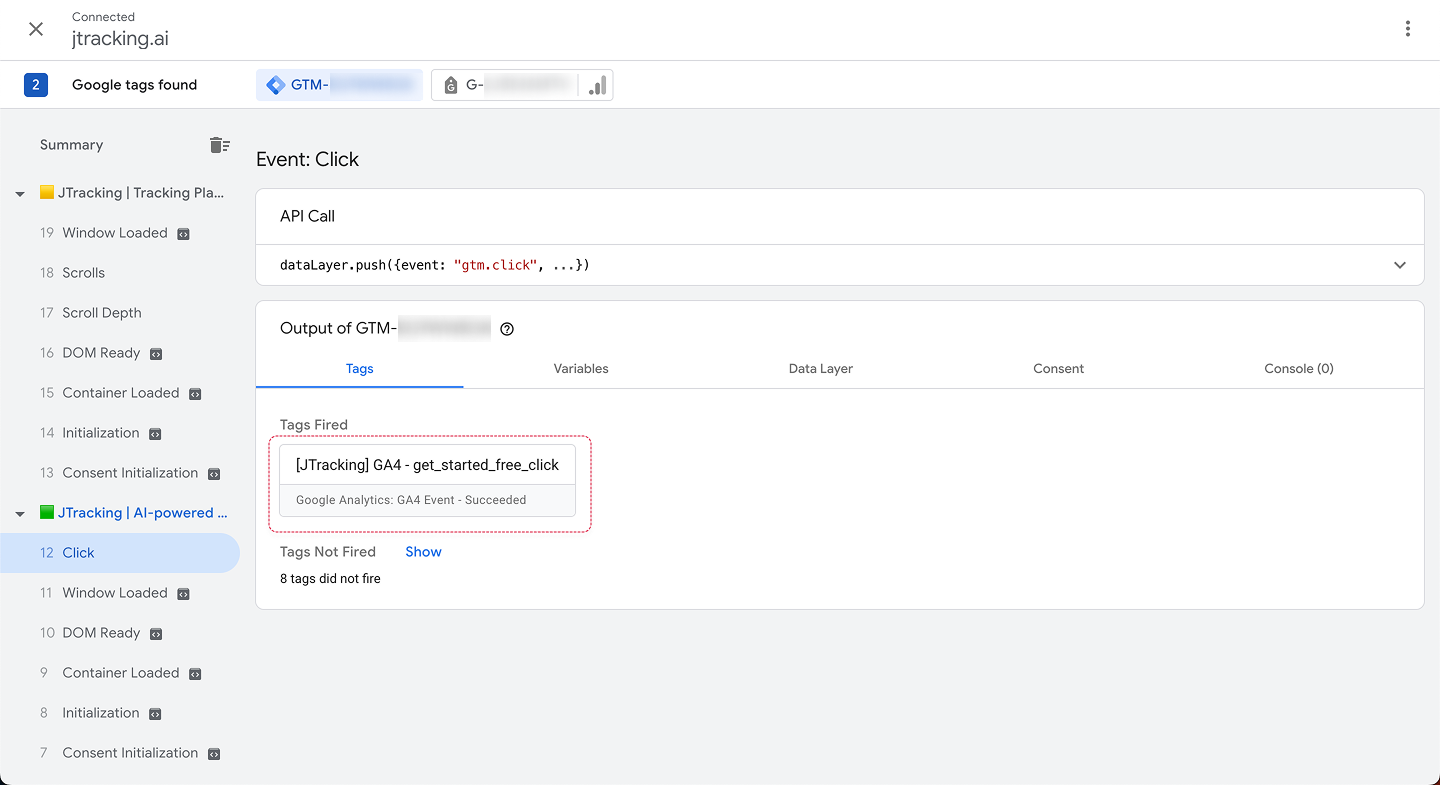
Step 2. Switch back to the Tag Assistant tab. In the left panel (Summary), events appear in time order. Click the event that matches the action you just did (e.g. Click if you clicked a button). In the right panel, check the Tags tab: Tags Fired lists the tags that ran for that event—for example [JTracking] GA4 - get_started_free_click with “Google Analytics: GA4 Event - Succeeded”. Tags Not Fired shows tags that did not run and why. Confirm the expected [JTracking] tag fired for this event.
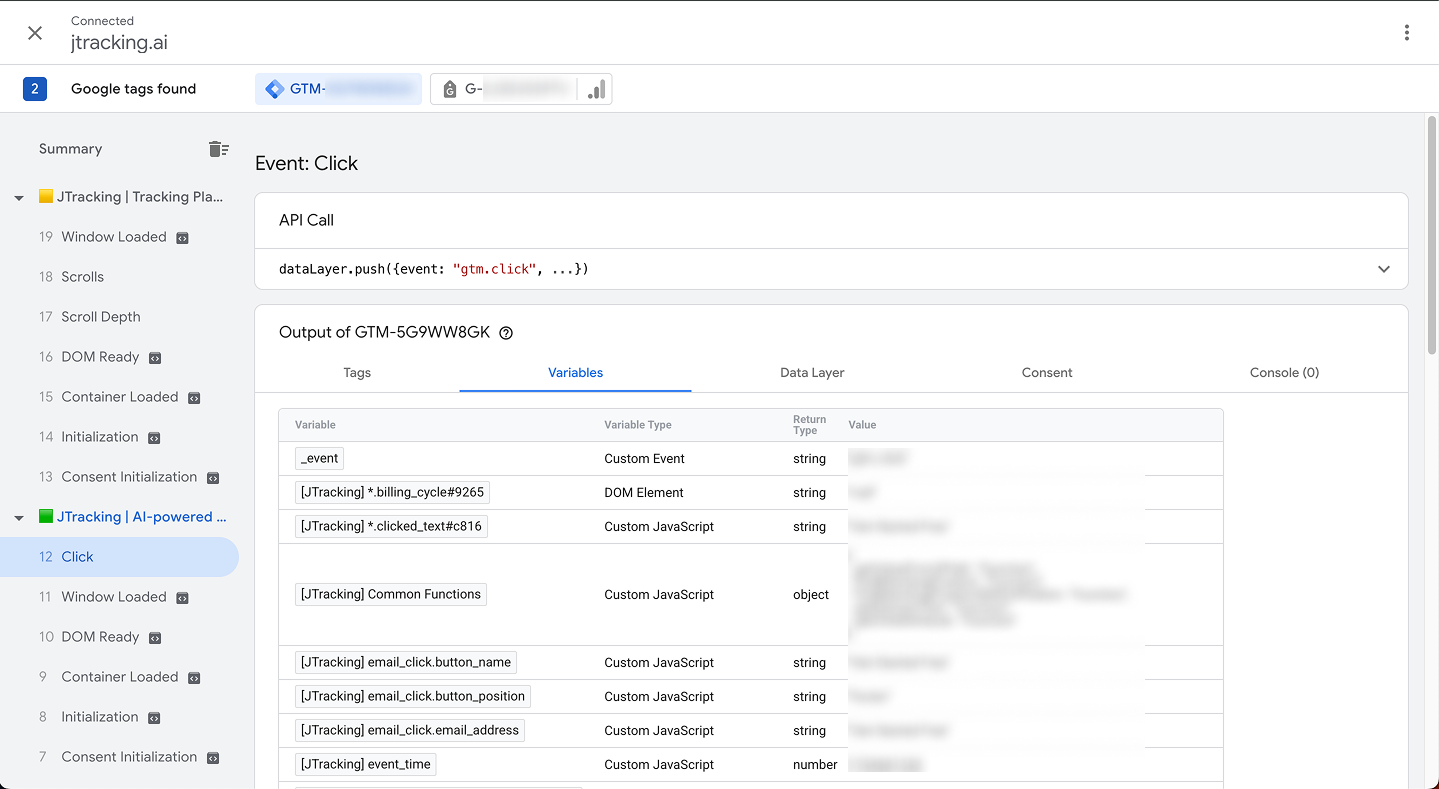
Step 3. In the same right panel, click the Variables, Data Layer, and Consent tabs to inspect the fields captured at the time of that event.
Step 4. Repeat Steps 1–3 for every tracking point you care about: trigger each action on the preview site, then in Tag Assistant select the corresponding event in Summary, check Tags Fired for the right [JTracking] tag, and use Variables / Data Layer / Consent to verify fields. Go through all configured events (e.g. page view, click, add to cart, begin checkout, purchase) until you are satisfied before Submit.
2. Submitting the correct Workspace
Note: Config only goes live after Submit. Deploy in JTracking only writes config into your GTM Workspace; it does not publish the container. You must Submit in GTM for changes to take effect on your site.
2.1 Publish the current Workspace
Step 1. In GTM, stay on the Workspace tab and confirm the workspace name at the top (e.g. Default Workspace). In the top-right, click Submit. A dialog opens for the new container version.
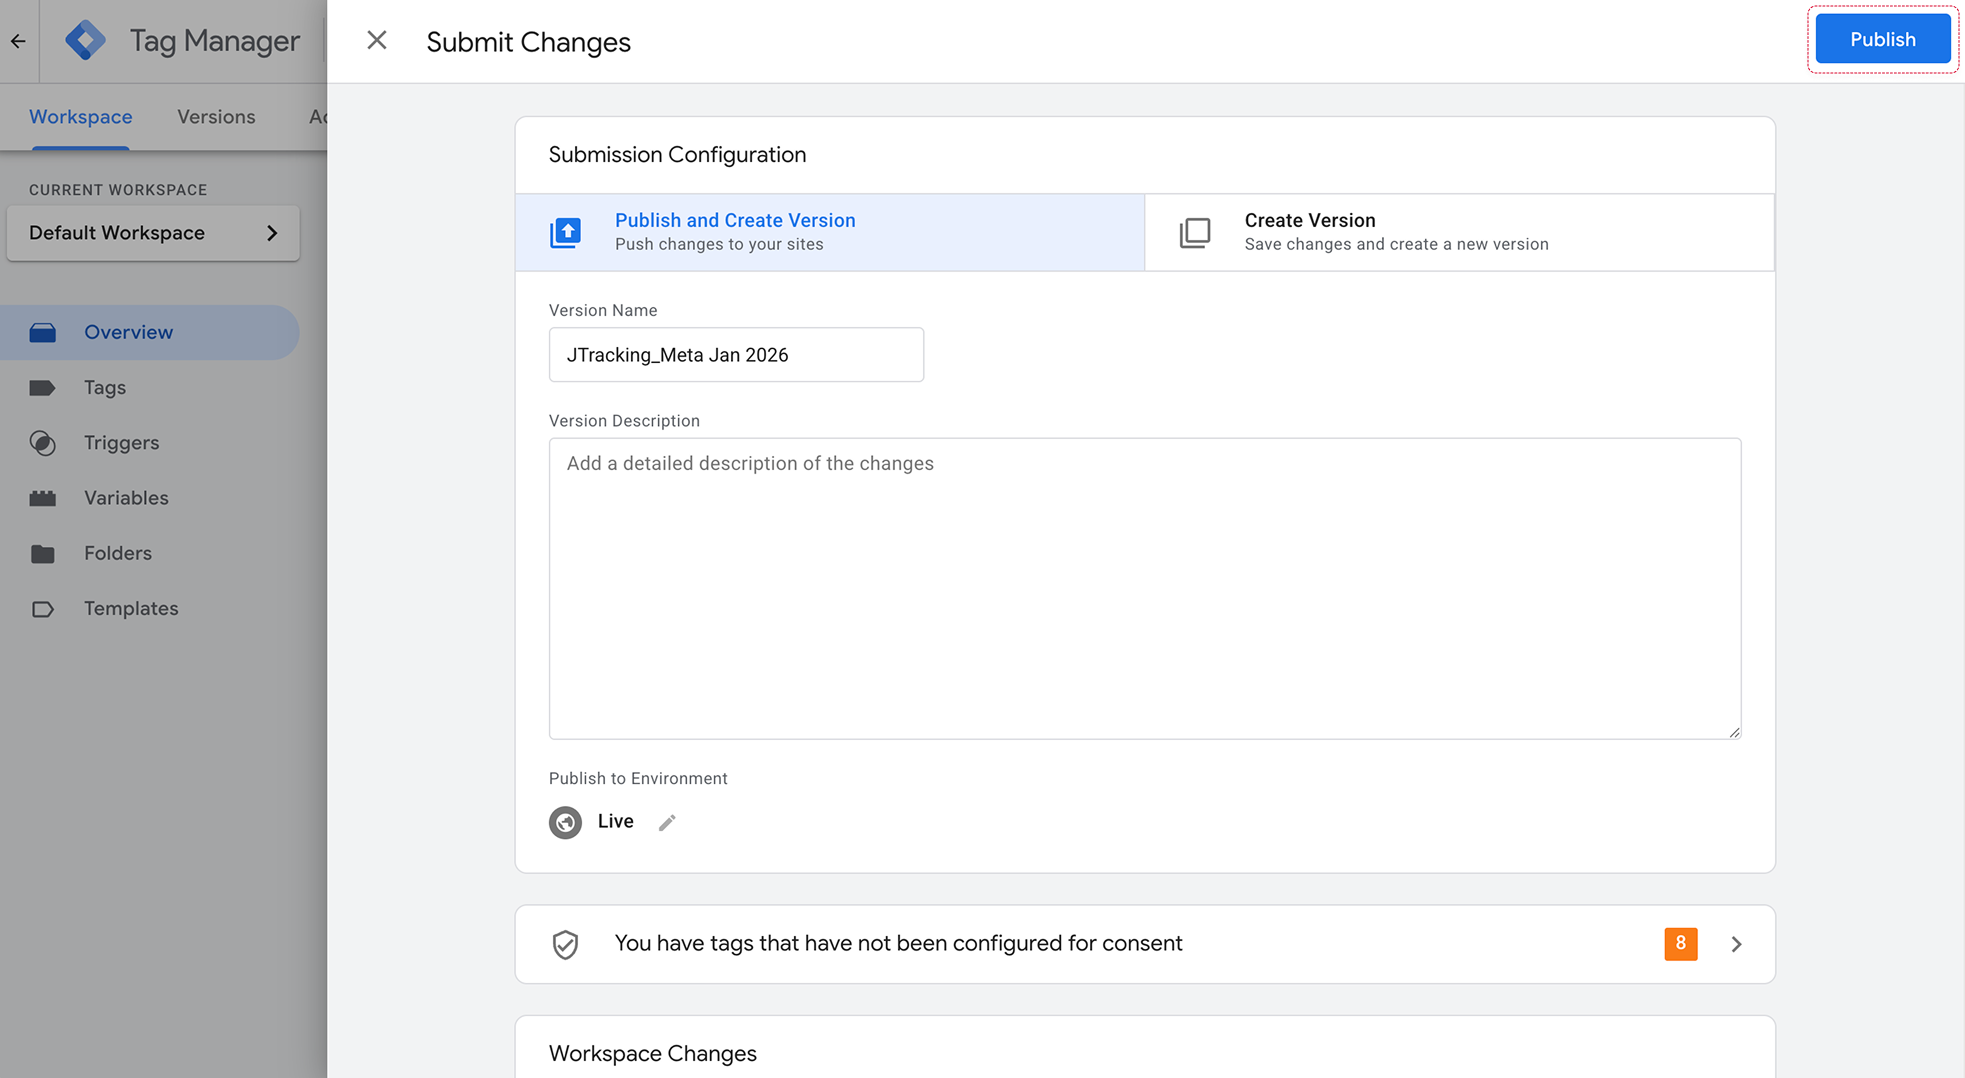
Step 2. In the dialog, enter a Version Name (required; e.g. “JTracking + Meta Jan 2026”) and optionally a Version Description (e.g. what changed or why). Click Submit. The current Workspace is published as a new container Version. Tags then run in production and send live data (no debug flag) to GA4, Meta, Google Ads, etc.
Step 3. Confirm successful submit. In the Workspace tab the Live Version card shows the new version (e.g. “Version 64”).
Note: Workspace management suggestions
- Always preview before Submit: Run through the main flows on your site (page views, add to cart, checkout, etc.) in Preview and confirm tags and parameters before submitting.
- Version names: Use clear, consistent names and descriptions (e.g. date + “JTracking + Meta”) so you can find and roll back if needed.
- Backups and rollback: Go to the Versions tab to view all published versions (each Submit creates a version with a Version ID, name, Published date, and Published By). To roll back, open the three-dot menu next to a previous version and use Set as Latest Version to make that version the active workspace, then Submit it to publish again; or use Publish from the menu if the UI offers it for that version. You can also Export a version to save a backup file. Google’s guidance on publishing, version history, and reverting is in Publishing, versions, and approvals.Multiple workspaces: Use different workspaces for different purposes (e.g. “dev”, “release”) and manage them under Manage workspaces to avoid accidental Submit from the wrong workspace.
- Multiple workspaces: Use different workspaces for different purposes (e.g. “dev”, “release”) and manage them under Manage workspaces to avoid accidental Submit from the wrong workspace.
3. After Submit: view results in JTracking Dashboard
Step 1. After you Submit in GTM, live traffic from your site is sent through the published GTM config (including JTracking tags) to your sGTM and downstream platforms.
Step 2. Go back to JTracking, and go to Dashboard → Overview. On the Overview page, use these three areas to confirm everything is working:
- sGTM Usage — Monitor server request usage. The section shows requests received vs. your plan limit (e.g. “415 / 50,000 requests received”), usage percentage, and when the quota renews. Use this to confirm the server is receiving traffic and to avoid exceeding your plan.
- Data Flow Topology — Check that the data path is healthy. The diagram shows Web Source (e.g. your store domain) → JTracking Server (with status such as “Healthy”) → Destinations (e.g. Google Analytics 4, Google Ads, Meta). Confirm the source and server show “Active” or “Healthy”, and that each destination you configured shows “Connected” (not “Disconnected”).
- Data Reception — Monitor received event volume. The table lists EVENT NAME, TOTAL RECEIVED, and LATEST RECEIVED (e.g.
view_item,add_to_cart,purchase,begin_checkout). Use the time filters (e.g. “Today”) and refresh to confirm events are arriving after Submit and that counts and timestamps look correct.