How to Measure and Optimize Key Metrics in the SaaS Industry? (Part 2)
4. The Three Key Factors Affecting a SaaS Company's Bookings
For a SaaS company, three factors influence the month-over-month changes in Monthly Recurring Revenue (MRR):
● New MRR: The MRR generated by new customers purchasing the service.
● Churned MRR: The MRR lost due to existing customers discontinuing the service.
● Expansion MRR: The MRR gained from existing customers upgrading or purchasing additional services.
These three factors together determine your net new MRR bookings.
You can use a chart similar to the one below to track these data points:
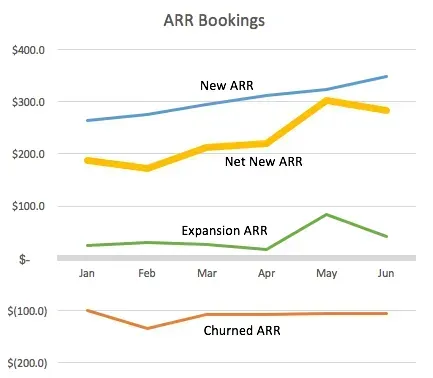
This chart illustrates the three components of Annual Recurring Revenue (ARR) or MRR bookings, along with the net new ARR (or MRR) bookings. By breaking down each component, you can track the key drivers of business growth. This is one of the most critical charts for understanding and managing your SaaS business.
5. The Importance of Customer Retention
For an early-stage SaaS company, churn rate may not seem particularly critical.
For example, if your monthly churn rate is 3% and your company has only 100 customers, losing 3 customers per month is relatively insignificant because you can easily acquire 3 new customers to replace them. However, as your company scales, the impact becomes much more pronounced. If you have 1 million customers, a 3% churn rate means losing 30,000 customers every month, which is far more challenging to replace.
A commonly overlooked aspect of churn rate is that, along with new ARR, it not only determines how fast your company can grow but also how large it can ultimately become.
By building a simple model using your company’s current ARR data, you can plot it on a curve to assess your position. Are you on the left side of the curve, where ARR is growing rapidly and the ceiling is still far away? Or are you on the right side, where revenue growth has plateaued with little room for further expansion? Small improvements in churn rate or customer acquisition can have a significant impact depending on your position on this curve.
6. The Power of Negative Churn
The ultimate solution to reducing churn is achieving negative churn.
What is Negative Churn?
Negative churn occurs when the additional revenue from existing customers exceeds the revenue lost from customer churn.
How Can a SaaS Company Achieve Negative Churn?
There are two main strategies:
1. Implement a tiered pricing strategy.
2. Some customers are willing to pay significantly more for a premium version of your product. The key is to introduce a multi-tier pricing model that allows companies to charge higher prices for customers who derive greater value from the product. Expand product offerings through upselling and cross-selling.
By bundling multiple products or introducing additional features, you can increase the revenue generated from existing customers. To better understand the power of negative churn, consider the following cohort analysis charts, which illustrate the difference between a 3% churn rate and a -3% churn rate.
What is Cohort Analysis?
Cohort analysis groups users based on their signup period and tracks their retention and revenue over time. This method provides insights into user behavior and the long-term impact of product improvements or retention strategies.
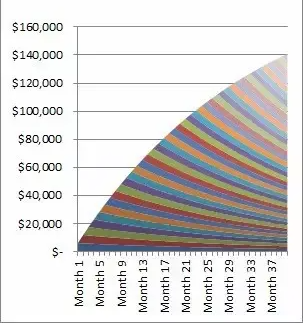
In the first chart, where the company experiences a 3% monthly revenue churn rate and maintains a constant monthly booking value of $6,000, total revenue after 40 months is approximately $140,000, and growth slows down significantly.
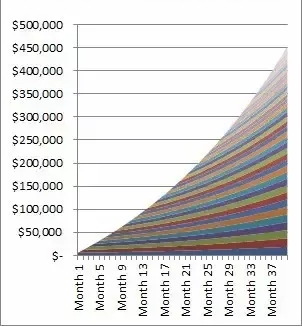
However, in the second chart, while the company also loses some customers, the remaining customers contribute significantly higher revenue, more than offsetting the loss. With a -3% revenue churn rate, the company’s total revenue after 40 months reaches $450,000—more than three times the revenue in the first scenario, with growth accelerating over time.
Revenue Churn Rate vs. Customer Churn Rate: Why Are They Different?
You may wonder why it is necessary to track both customer churn rate and revenue churn rate. The following example illustrates the difference:
Suppose your company has 100 customers, where:
● 50 small customers each pay $100 per month.
● 50 large customers each pay $1,000 per month.
In this case, your total MRR is $55,000.
Now, assume you lose 10 customers in a given month. This results in a customer churn rate of 10%. However, if 9 of the 10 churned customers are small customers and only 1 is a large customer, the lost MRR is only $1,900, leading to a revenue churn rate of just 3.4%.
This example highlights a critical insight: customer churn rate and revenue churn rate can differ significantly. Monitoring both metrics is essential for accurately assessing overall business performance.
To Be Continued...
This concludes the second part of the discussion on key SaaS metrics. The next section will delve deeper into additional strategies for optimizing growth and profitability.