How to Measure and Optimize Key Metrics in the SaaS Industry? (Part 3)
7. The Importance of Customer Prepayments
If customers are willing to prepay without reducing their order amount, it can be incredibly beneficial for your company. Prepayments provide valuable cash flow that can help address funding challenges. To encourage customers to prepay, it’s often worth offering them a discount in return.
In most cases, the longer the prepayment period, the better it is for reducing churn. This is because a prepayment represents a commitment to using your service, which also means customers are more likely to invest time in getting your product up and running internally. Additionally, if any issues arise during the early stages of deployment, having that commitment gives you more time to resolve them.
That said, prepayment isn’t without trade-offs. Requiring prepayment may deter some customers, particularly those less confident in their long-term needs, thereby impacting overall acquisition. As such, it’s important to balance between the volume of customers and the rate of prepayment.
8. A Deeper Look at Churn: Cohort Analysis
Since churn rate is one of the most critical factors determining a SaaS company’s success, understanding it requires deeper analysis. One of the most powerful tools to analyze churn is Cohort Analysis.
Cohort Analysis groups users based on when they signed up (typically by month), and then tracks their behavior over time — for example, looking at the retention rate of customers acquired in the first, second, third month, etc. That’s why it’s also known as "time-based cohort analysis."
As shown in the cohort chart below:
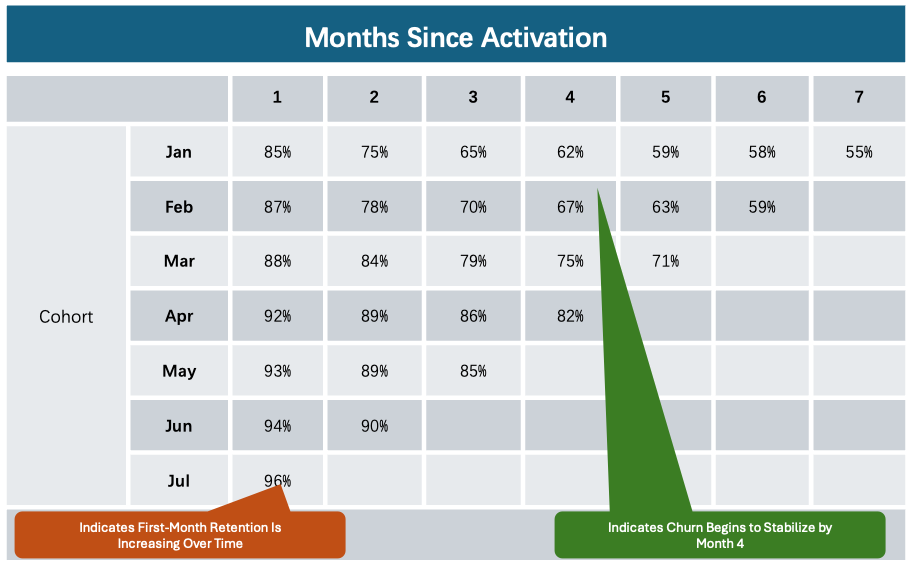
● From the vertical data (highlighted in red), we can see that the first-month retention rate of users acquired from January to July has steadily improved.
● From the horizontal data (highlighted in blue), we can see that churn for users acquired in January starts to stabilize by month four.
This kind of cohort analysis helps answer key questions like:
● Do most newly acquired customers churn after just a few months?
● Does churn eventually level out after a certain period?
If you take actions early on to reduce churn — such as offering better onboarding or improving key features — you’ll want to measure whether these changes actually worked. Cohort analysis allows you to compare the retention performance of recent cohorts (e.g., July signups) with earlier ones (e.g., January signups). As shown in the example above, churn in July’s cohort dropped significantly compared to January — from 15% to just 4%.
In such cases, calculating LTV (Customer Lifetime Value) requires a more advanced model, as the average customer value increases over time.
9. Predicting Churn: Engagement Scoring
Because churn is so crucial, it’s incredibly valuable to predict in advance which customers are most likely to churn. This allows your best customer success reps to proactively step in and retain those accounts.
One effective method is to track whether users are engaging with the "sticky" or high-value features of your SaaS product. For example, on Facebook, a user who uploads photos is far less likely to churn than someone who only logs in and views one page.
Similarly, if your product is sold to a department of 100 people but only 10 people use it, that department would receive a much lower engagement score than if 90 people were actively using it.
What is an Engagement Score?
You can create an engagement score system by assigning points to different product features based on how "sticky" they are. Award more points for actions tied to long-term usage, and track how many users perform those actions. Later, compare these scores with actual churn data to validate whether your scoring system correctly predicts churn risk.
Over time, you'll also discover which types of engagement are strongest indicators for upselling. (One of the first companies I worked with on this was HubSpot — they called their engagement score CHI, which stands for Customer Happiness Index. It later evolved into one of their most effective churn prediction tools.)
Net Promoter Score (NPS)
Customer satisfaction is also a strong predictor of future churn. Therefore, regularly measuring satisfaction is key. A widely-used method is the Net Promoter Score (NPS).
The beauty of NPS is that it's a standardized metric, allowing you to benchmark your company against others in the industry.
10. What Churn Can Tell You About Your Business
If your company has a high net revenue churn rate — say, more than 2% per month — it’s a clear sign that something is wrong. A 2% monthly churn rate means you’re losing about 22% of your revenue annually. As the company scales, this level of churn will severely hinder growth.
That’s why we recommend that when faced with many competing priorities, the first thing you fix is churn.
Common Causes of Customer Churn:
1. You failed to meet customer expectations:
a. The product didn’t deliver enough value.
b. It was unstable or had too many bugs.
2. The product isn’t sticky enough.
3. It might deliver value early on, but once that value is achieved, customers no longer see a reason to keep paying. To increase stickiness, make the product a core part of the customer’s daily workflow, and encourage them to store valuable data in your platform.You failed to get widespread adoption within the customer’s company, or they’re not using the product’s stickiest features.
4. You’re selling primarily to small businesses, many of which may shut down shortly after becoming customers.
5. You don’t offer a flexible pricing model that makes it easy for customers to increase their usage or spend.
How to Understand Why Customers Churn
The best way to understand why customers churn is to call them directly. If churn is a critical issue, the founder should make those calls. It’s important that the founder hears the issues firsthand — and once the problems are identified, the founder is usually the best person to fix them.